Home & housing
How much house can I afford?
Why the lender's limit isn't a budget, and how to find the price that still leaves a life left over.
A lender hands you a number, and it feels like permission: you’re approved for $600,000, so that’s your budget. It isn’t. That number is the most the bank is willing to lend, not the most you should spend, and this is where a lot of stretched, house-poor budgets come from. The better question to ask instead is: what’s the price that still leaves a life, and some savings, left over? Here’s how to find it on your own numbers instead of taking the lender’s ceiling as a target.
Why the lender’s limit isn’t a budget
A pre-approval comes out of a single ratio: your would-be housing payment measured against your gross income, with a ceiling somewhere around 36% to 43% depending on the loan. It’s a test of how much you could repay without defaulting, and lenders are comfortable running it right up to the edge, because the loan is secured by the house either way.
Look at what that ratio quietly ignores. It counts your mortgage against income before tax, so it never sees the cut that comes out of your paycheck first. It leaves out the money you’d put toward retirement. It doesn’t know about upkeep, childcare, the car loan, or the fact that you’d like to keep taking a vacation. Approve a house at the top of that ratio and every one of those things has to be squeezed out of whatever’s left, which is often close to nothing.
“Approved for” and “can afford” are different questions
The full monthly cost: mortgage, taxes, insurance, upkeep
The mortgage payment is the number on the listing’s affordability estimate, and it’s the smallest honest version of what owning costs. Three more lines ride alongside it, and most of them scale with the price, so a pricier house costs more on nearly every one.
- Principal and interest. The loan payment itself, fixed for the life of the mortgage. ifso builds the real amortization schedule, with interest charged monthly, so the payment is the genuine number. If you decide to start paying extra towards the principal at any point in the life of the mortgage, ifso will recalculate the amortization from that point forward and show you the new monthly cost and breakdown of principal and interest.
- Property tax and insurance. Both ride on the home’s value, not the loan. ifso charges them automatically every year as a percentage of the place, so they climb with the price and keep running even after the mortgage is paid off.
- Upkeep, which never stops. Roofs, water heaters, the surprise. A rough rule is about 1% of the home’s value a year, and a more expensive house is a more expensive thing to maintain. You add this as an expense; the bank’s ratio never counted it at all.
- The down payment’s bite. Not a monthly cost, but the one that decides your cushion. The bigger the house, the more of your cash it takes off the table on day one, and the thinner your reserve for the month something goes wrong.
Add the first three together and you get the true monthly cost of the house, which is routinely a third again more than the mortgage quote alone. That’s the number a real budget has to survive, not the payment.
The math: down payment, rate, and what’s left each month
Affordability is really two constraints wearing one question. One is a liquidity question, set by the down payment: how much cash the purchase takes out of your accounts up front. The other is a cash-flow question, set by the monthly cost: how much of your income the house eats every month, and whether anything is left to build with.
The down payment is funded in ifso from whichever account you point it at, so you watch it come straight out of your savings. A 20% down payment on a bigger house can swallow most of your reserve, which matters less for the monthly math and more for the first bad month afterward, when the cushion is what you reach for.
The rate moves the payment more than the price does. At today’s levels a point of mortgage rate changes the monthly cost as much as tens of thousands of dollars of house would, so it’s worth nudging the rate in ifso and watching the payment respond before you fixate on the sticker price.
What’s left each monthis where the real answer lives. ifso runs your income, takes out the tax it owes, subtracts the full housing cost and the rest of your expenses, and shows you the surplus that remains. A "primary account" invests that surplus automatically, month after month. Buy too much house and the surplus turns negative, at which point ifso covers the gap by drawing back out of your savings, and your net worth line flattens or bends downward. That flattening is the affordability answer, stated more honestly than any ratio: the right price is the most expensive house where the line still climbs.
Reading it in the monthly cash flow
A worked example in ifso
Priya is 34 and earns $135,000, which after tax lands around $8,700 a month. She has $140,000 in a brokerage account to put toward a home and a 401(k) she keeps feeding. Her lender pre-approved her for a $600,000 house, and she wants to know whether that’s a house she can actually live behind, or just one she can borrow for.
The max scenario. A Buy event at 34 for the $600,000 home, 20% down ($120,000) pulled from her brokerage, a 30-year mortgage at 6.5%. That leaves a $480,000 loan. Add it up the way ifso does and the house runs about $4,384 a month all in: roughly $3,034 of principal and interest, $1,100 of property tax, and $250 of insurance. The down payment left her a cushion of only around $20,000.
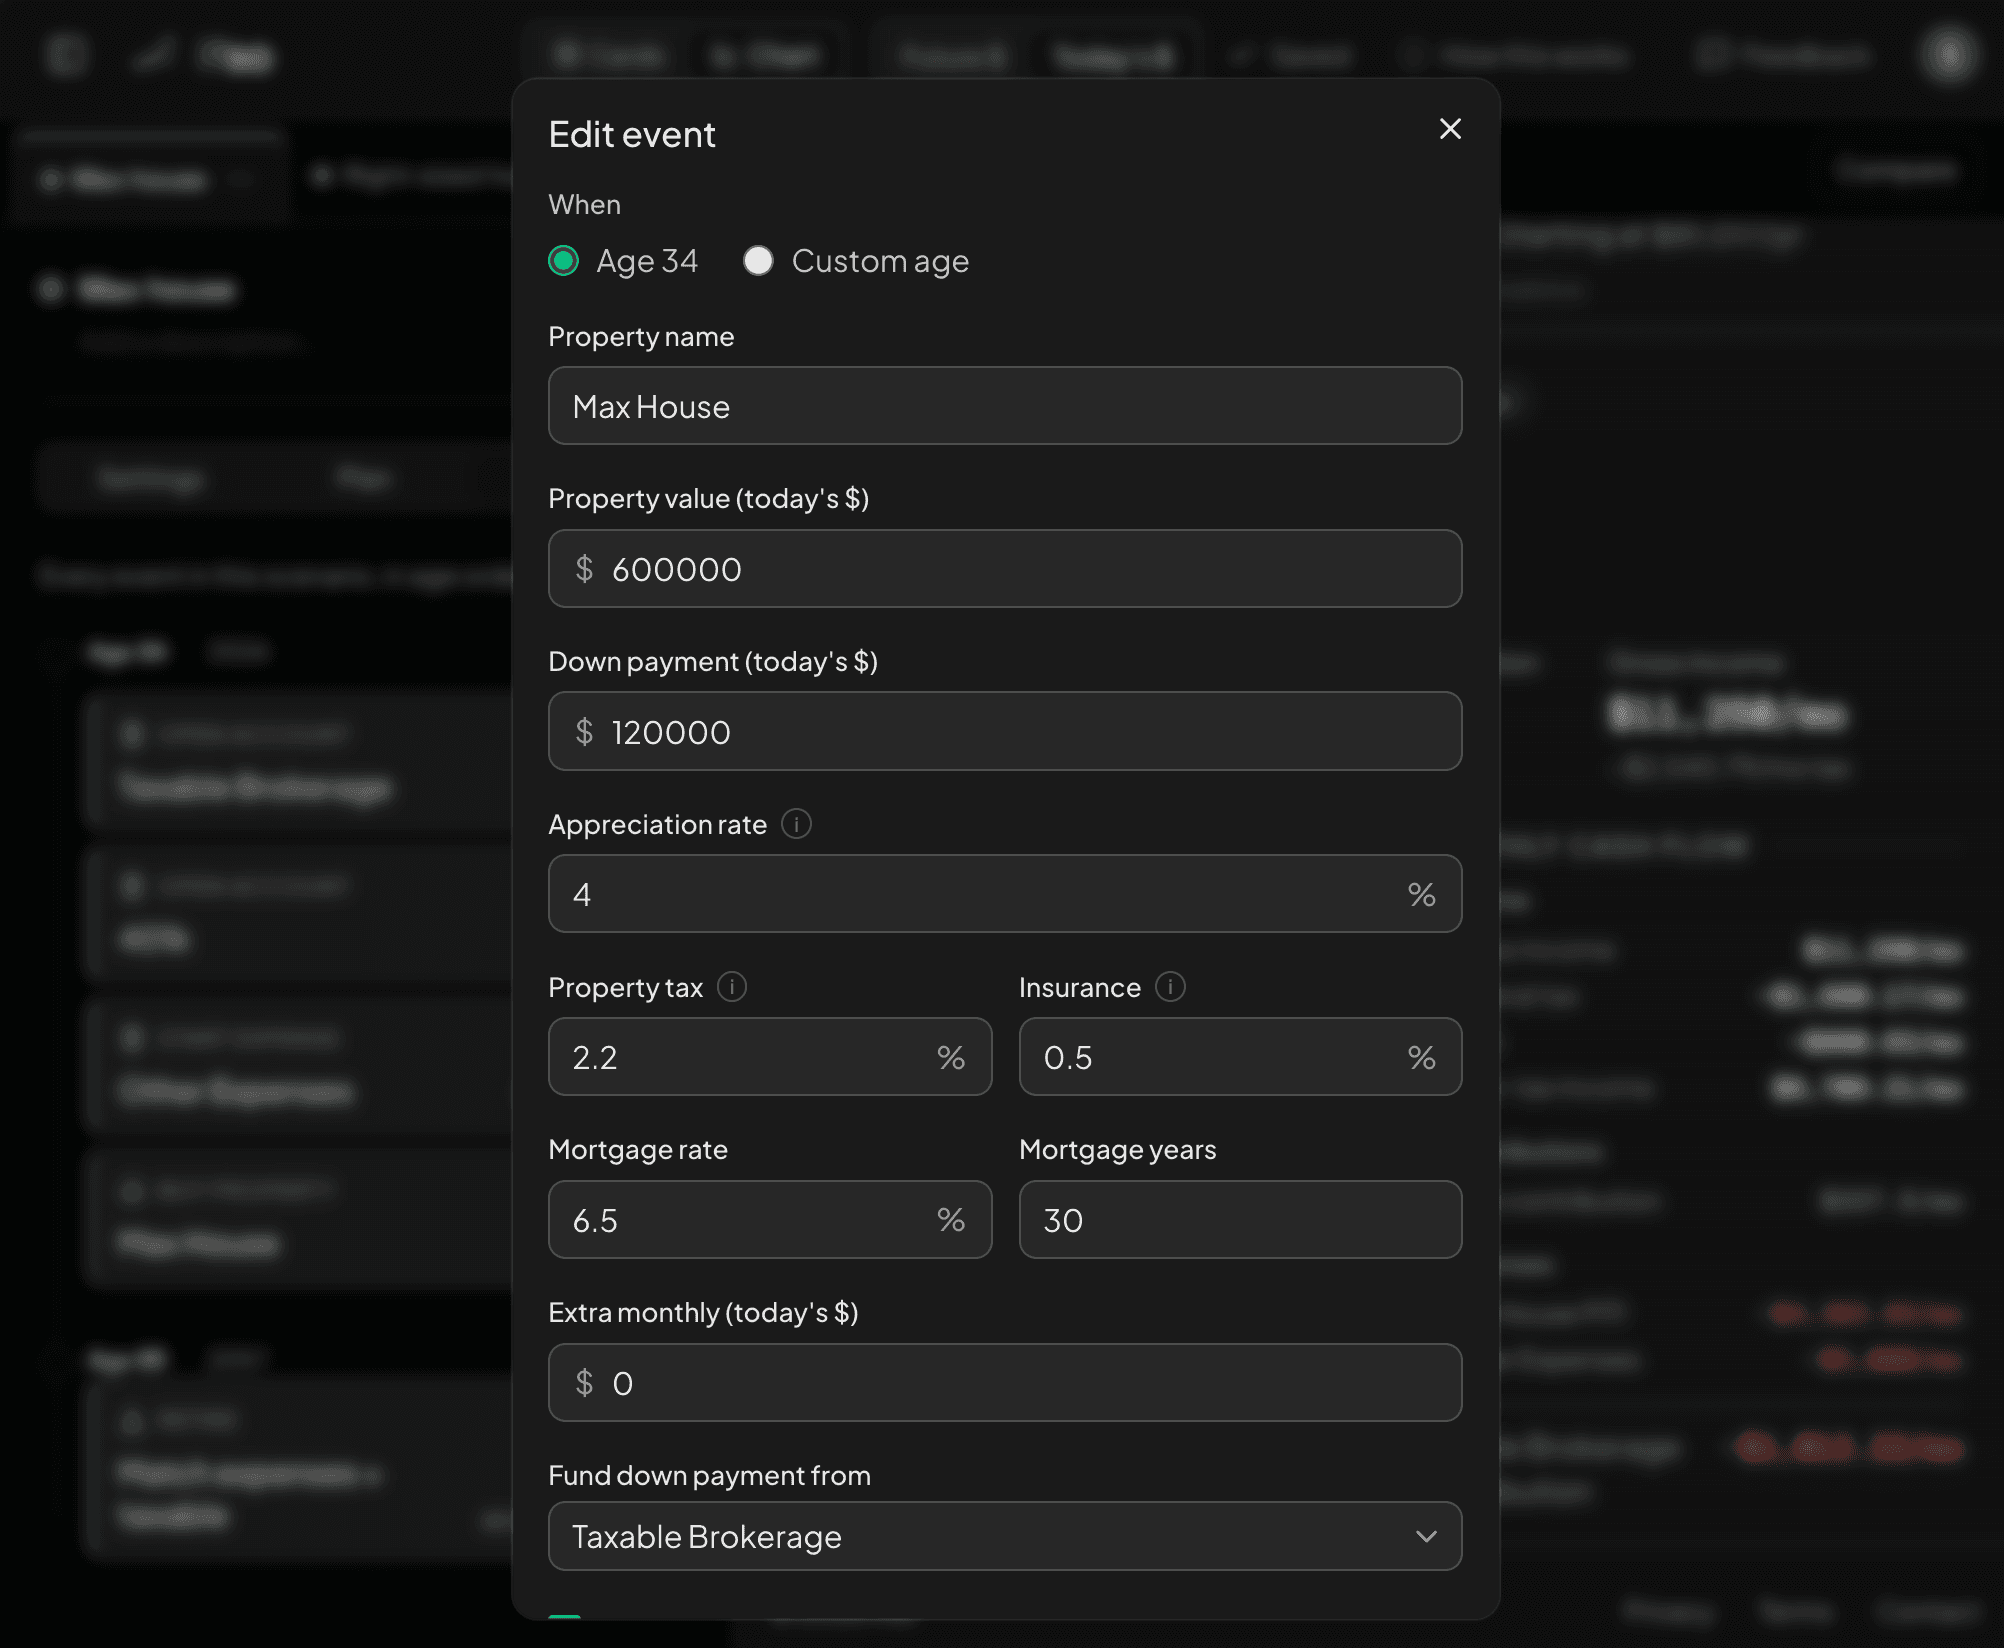
Now watch what that does to the rest of her life. Her $8,700 of take-home has to cover the $4,384 house, her $338 monthly 401(k) contribution, and about $5,000 of everything else, food, her car, insurance, upkeep, the occasional trip. That leaves her roughly $1,000 a month in the red before she’s invested a spare dollar, so ifso pulls the gap back out of her thin cushion every month. Her net worth barely moves, then starts to slide. She’s not defaulting, but she’s running backward, one bad month from real trouble.
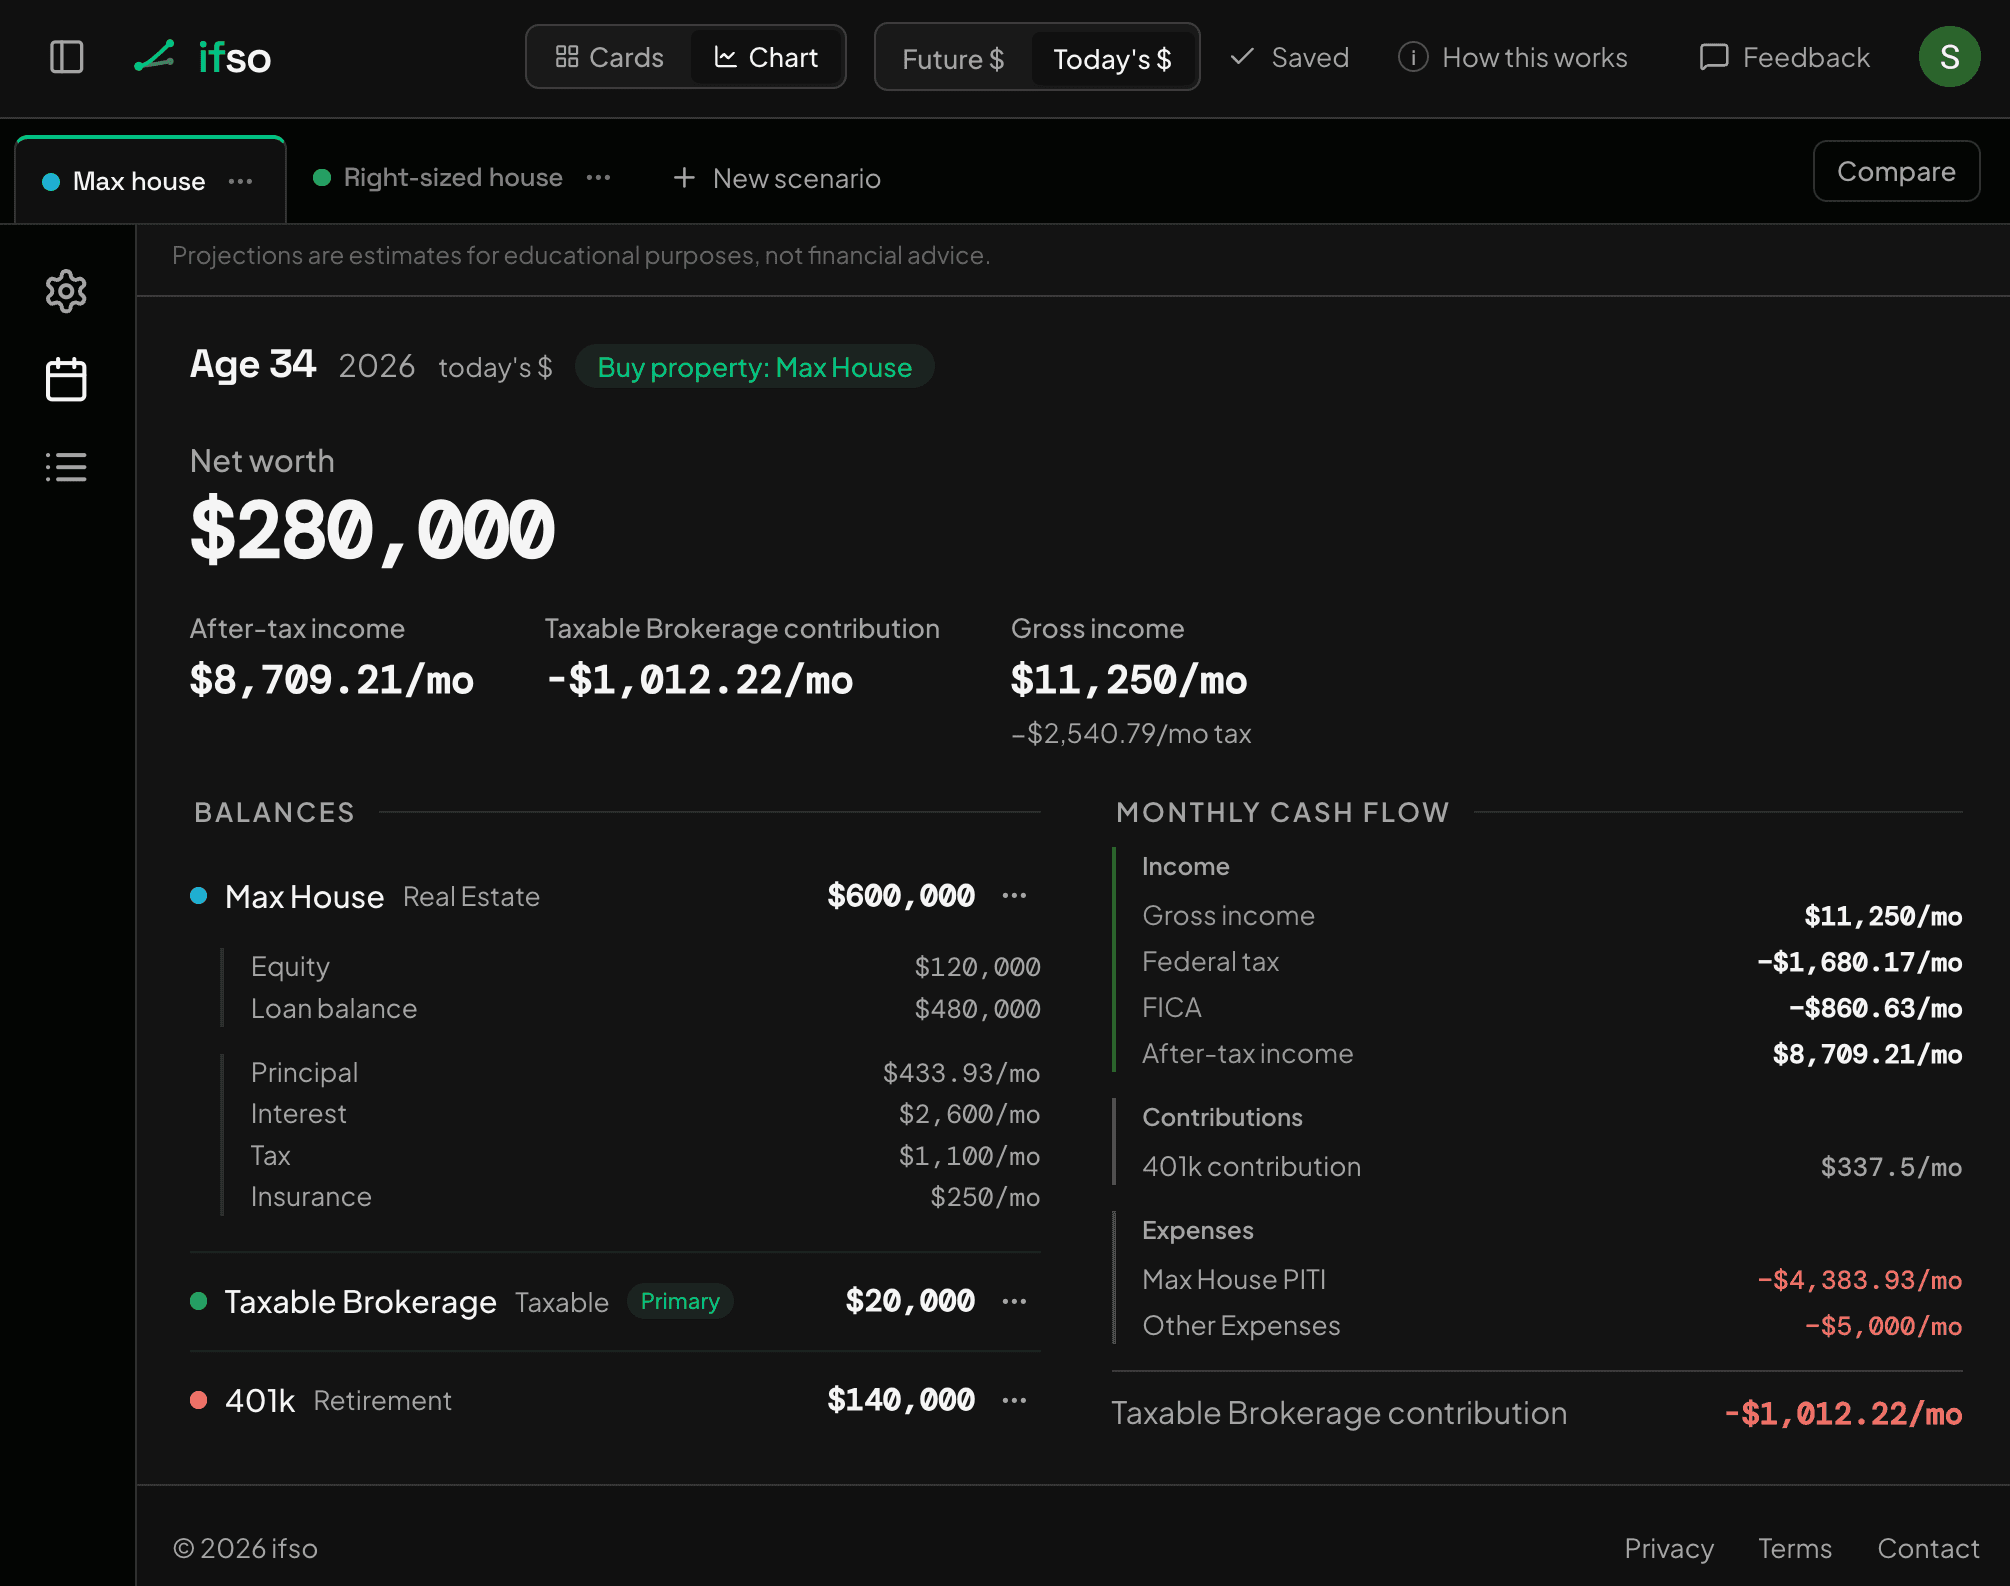
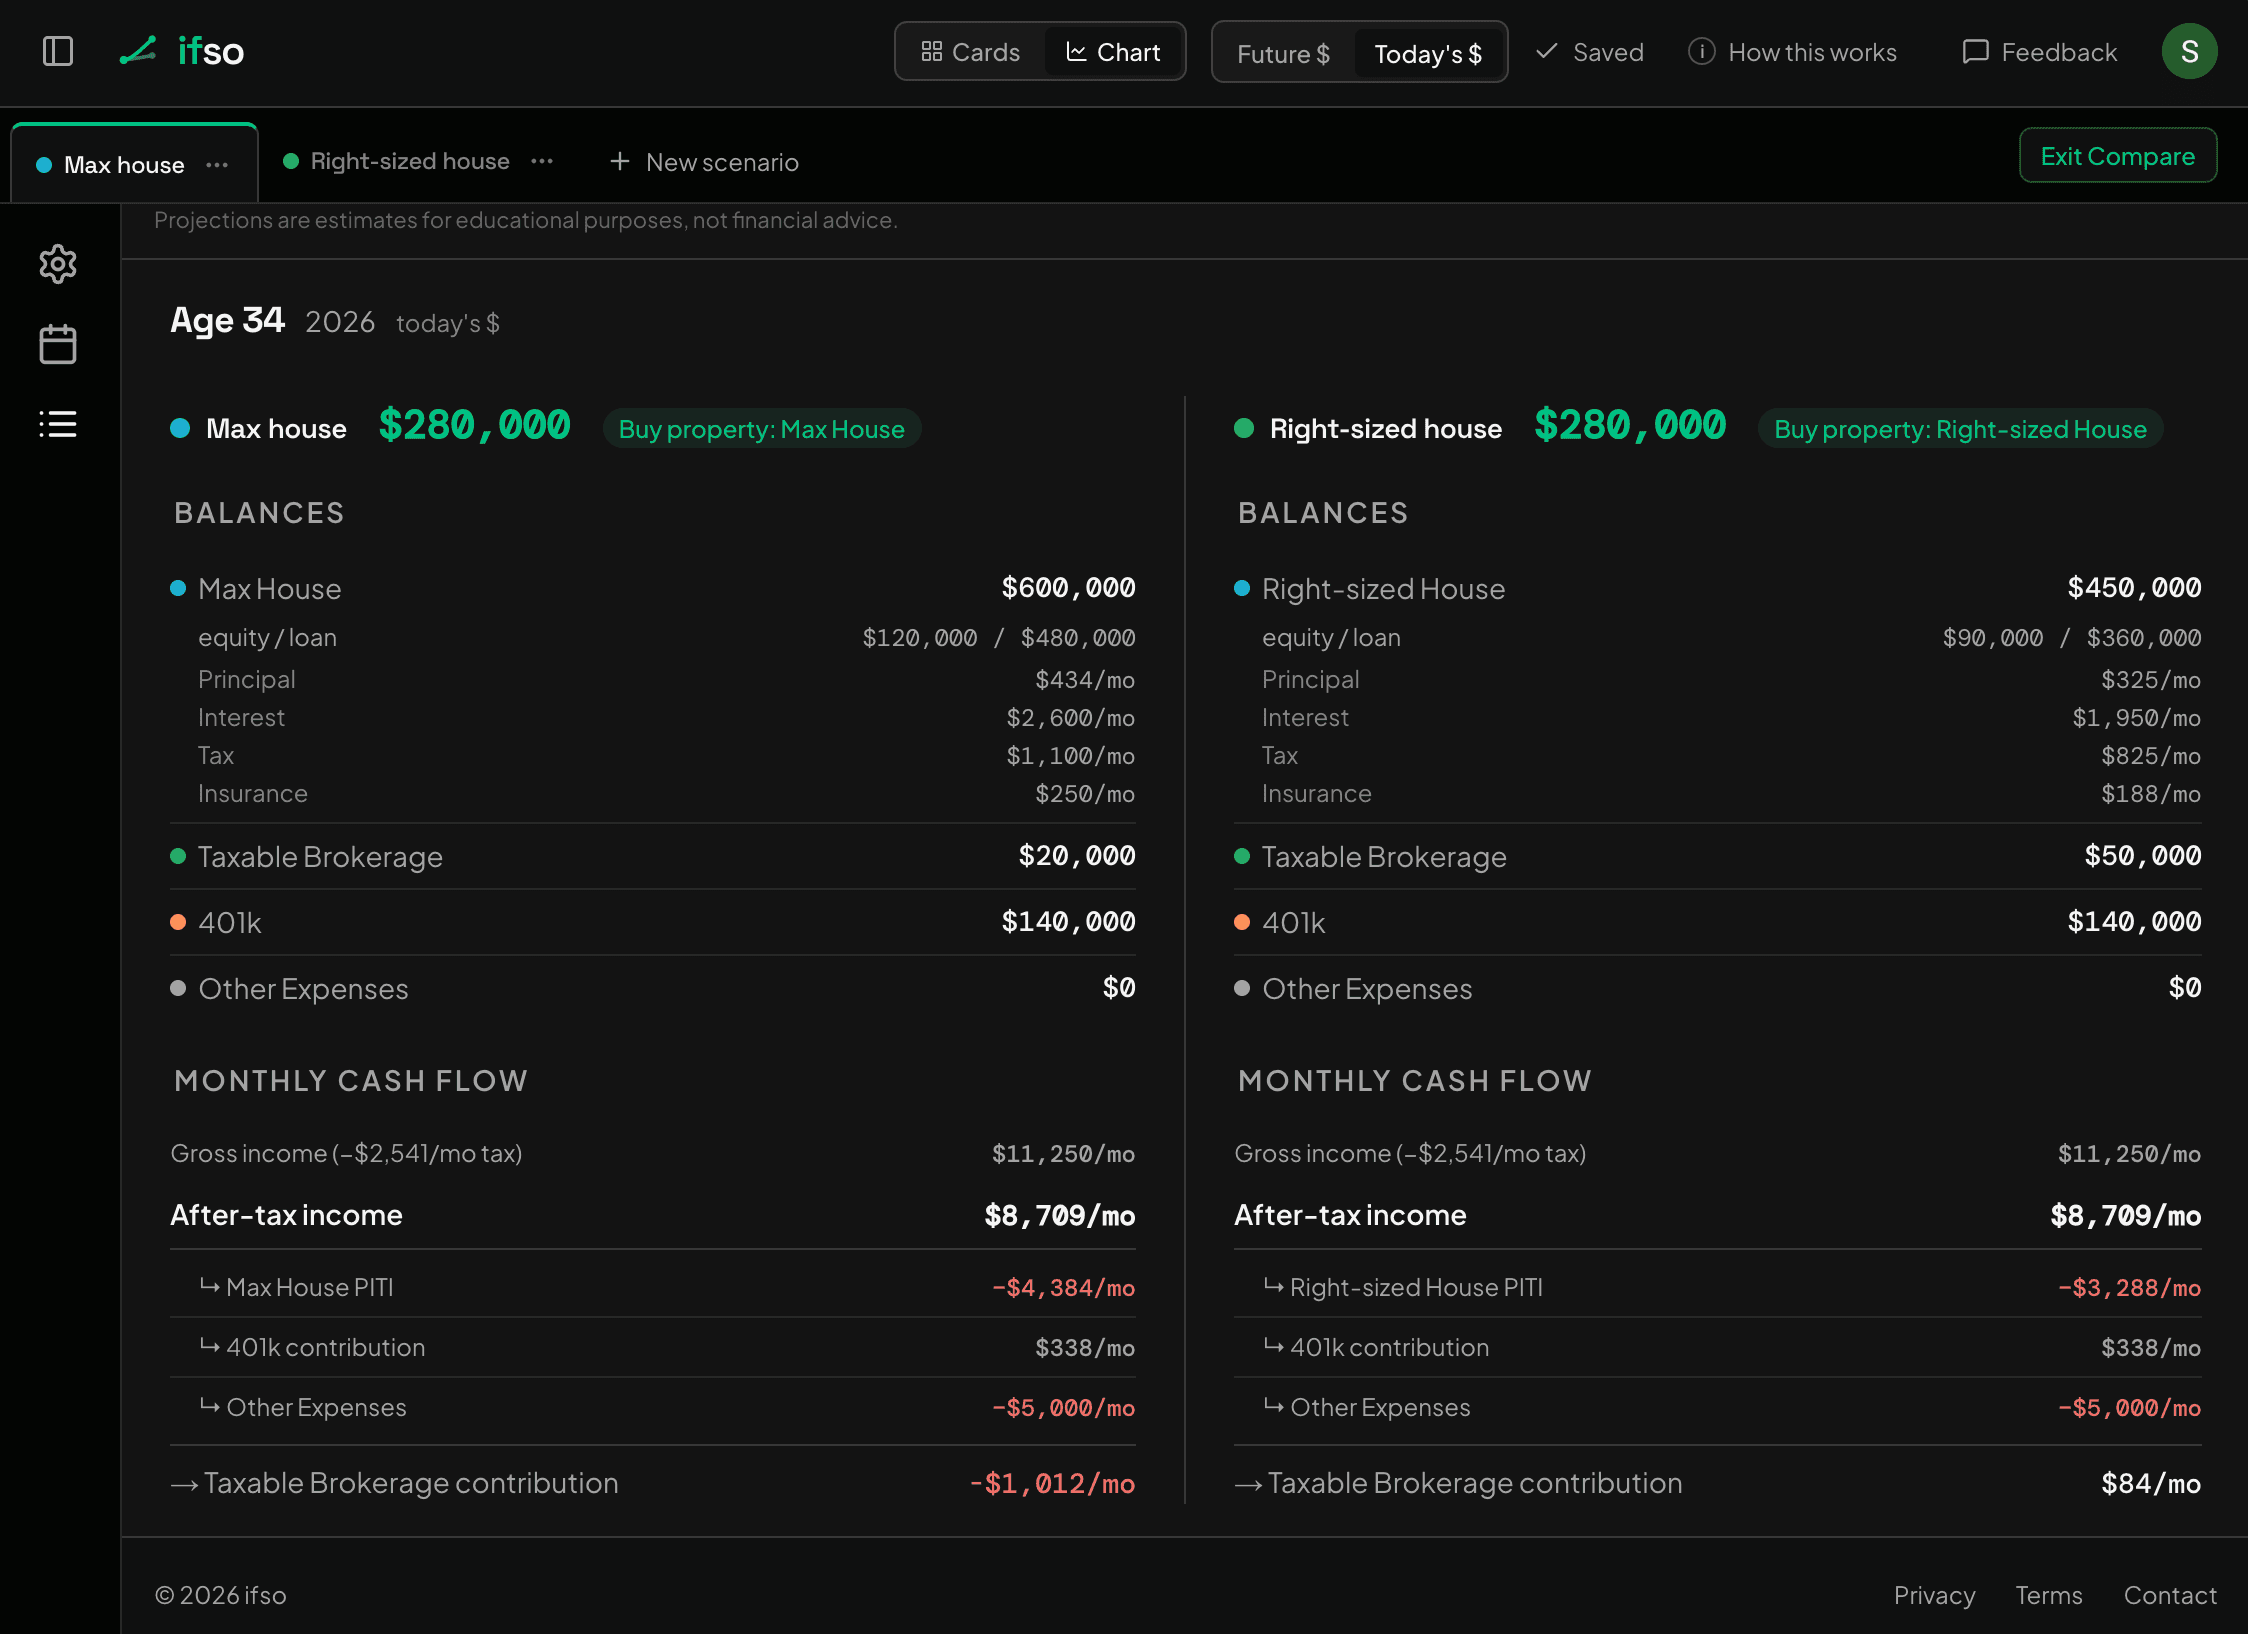
The right-sized scenario. Clone it and drop the house to $450,000, everything else the same. The down payment falls to $90,000, leaving her a real $50,000 cushion, and the house now runs about $3,288 a month all in. That swing is enough to flip her monthly number from $1,000 in the red to a small surplus, about $84 a month at first. It’s slim, but it’s the right sign, and because her income rises over the years while the mortgage stays fixed, that surplus widens and compounds instead of draining. The net worth line climbs instead of sliding, and the $50,000 cushion is there for the surprise.
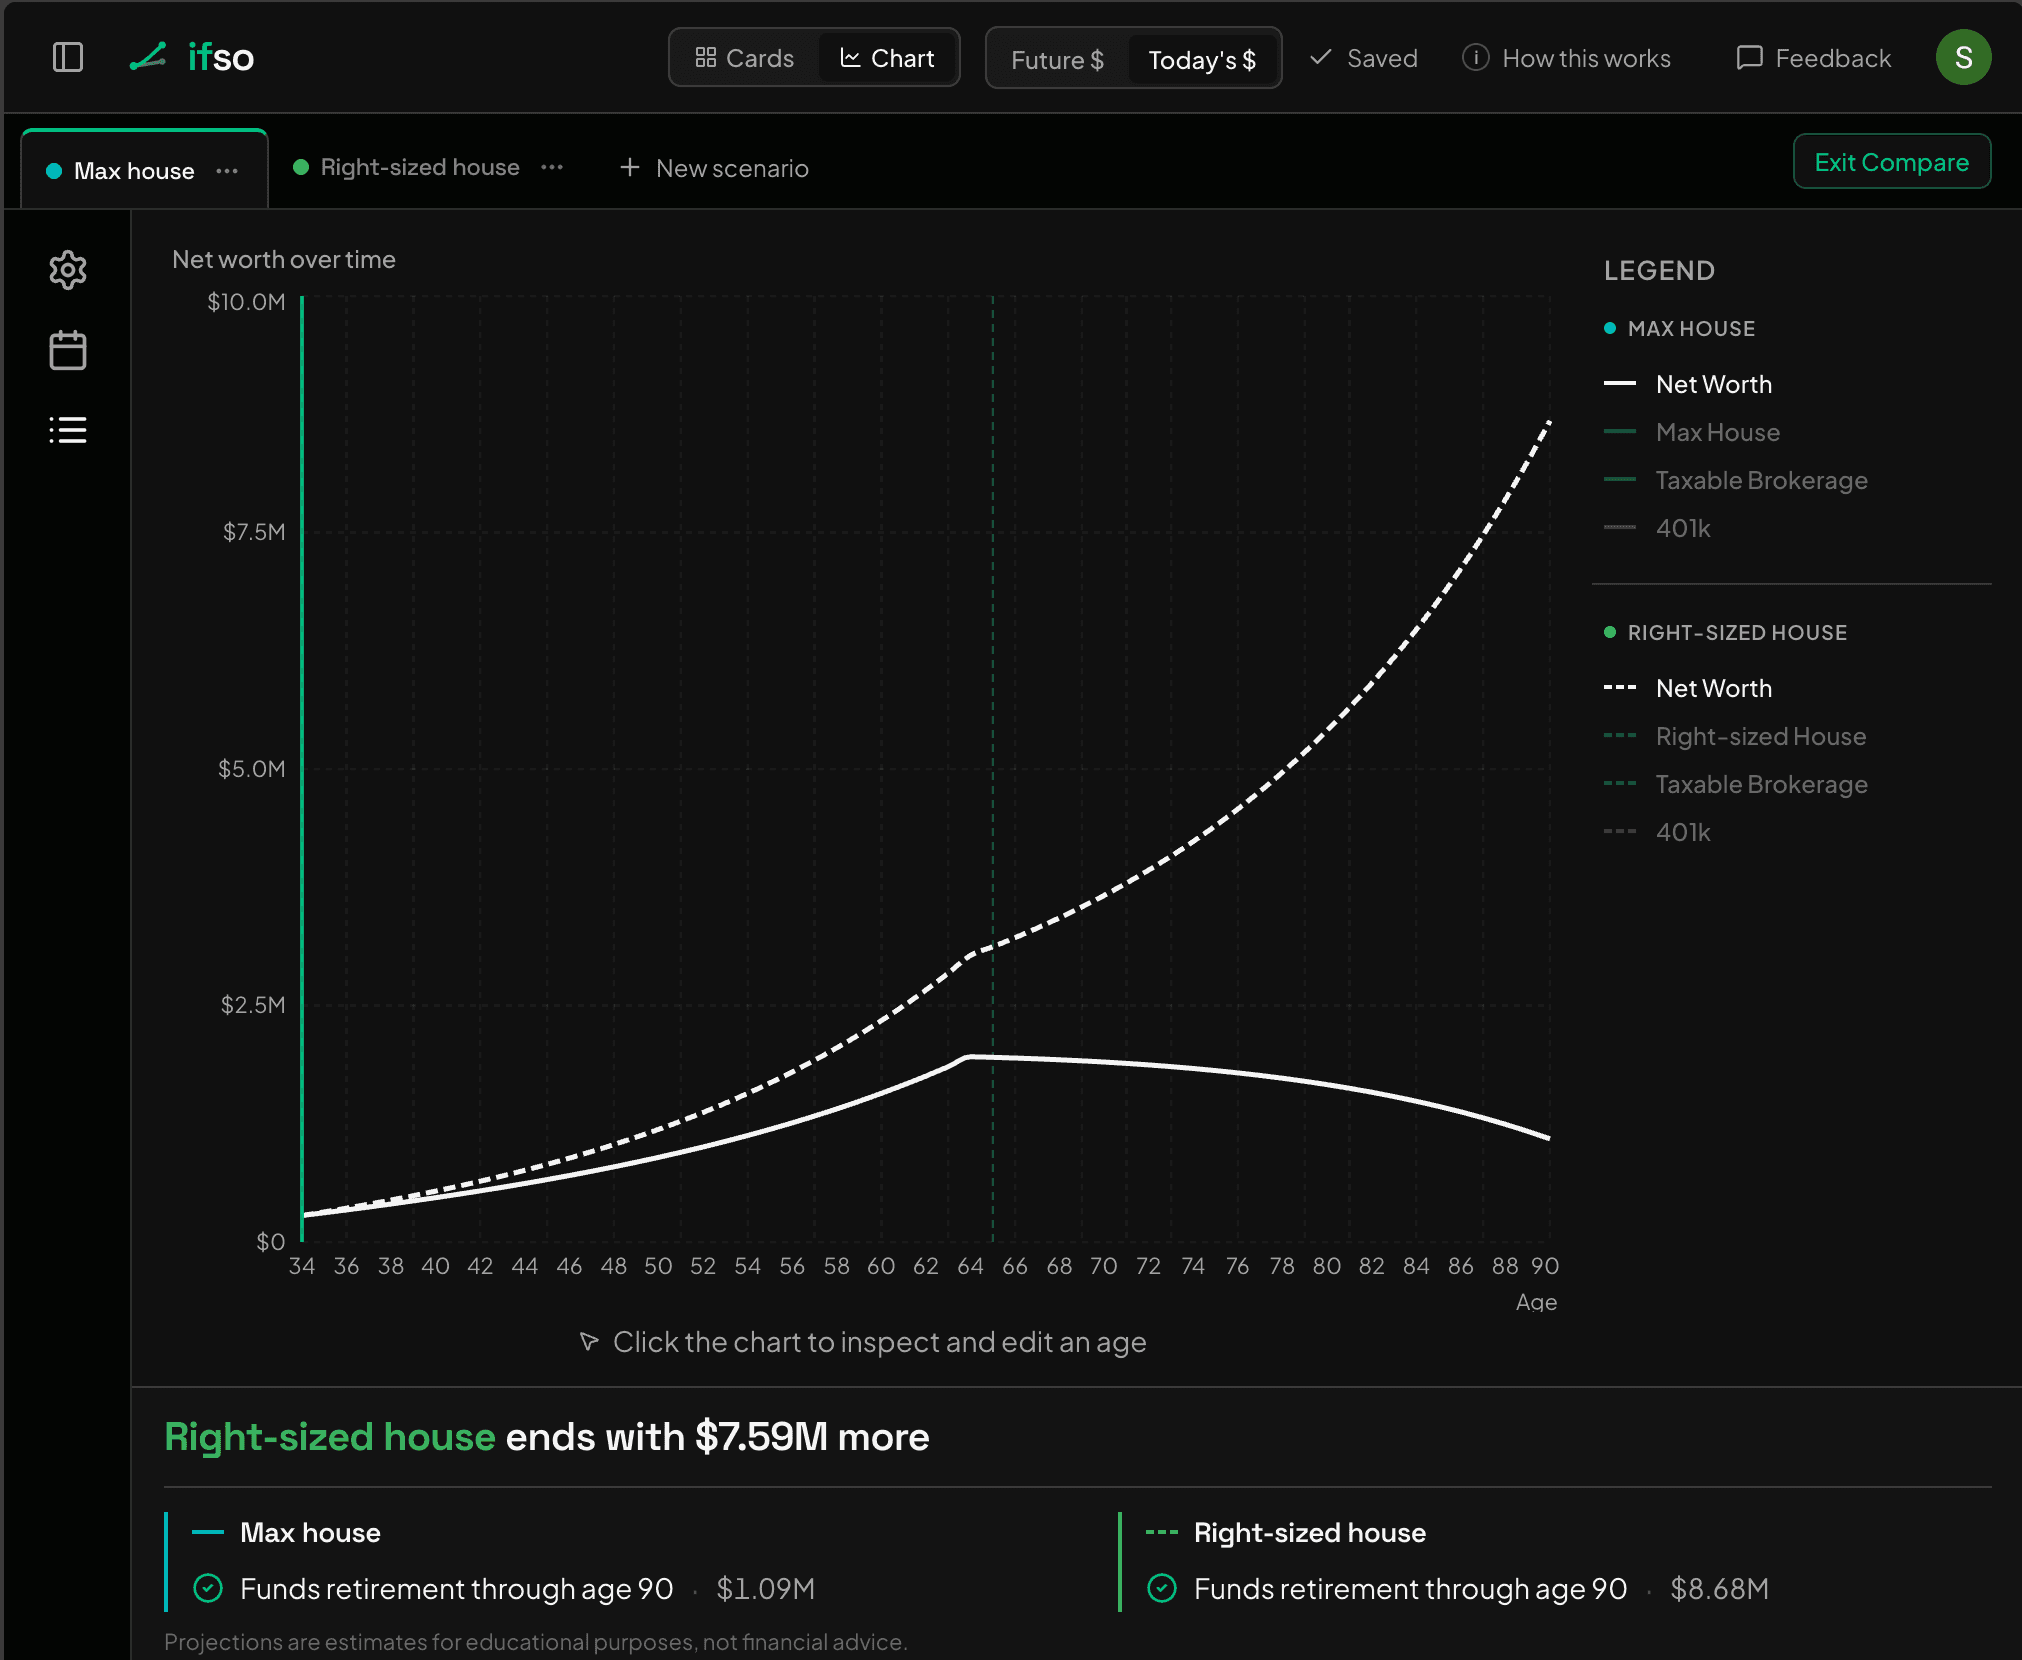
Same person, same paycheck. The $150,000 of house Priya didn’t buy is the whole difference between the two futures. Both plans technically fund her retirement, so a lender’s ratio was never going to separate them. But the max house peaks in her early sixties and erodes to about $1.09M, while the right-sized house compounds to $8.68M, a $7.59M gap. Put the two side by side at the very first month and you can already see it coming: the same $8,709 of take-home leaves the max-house Priya $1,012 in the hole and the right-sized Priya $84 ahead.
What changes the answer
Flip any of these and the price you can carry moves with it:
- The mortgage rate. It’s the heaviest lever on the monthly cost, heavier than the price itself. The same house at 5% and at 7% are two different budgets, so lock the rate you’ll actually get before you decide what you can carry.
- How much cushion you keep. A larger down payment shrinks the loan and the payment, but it also drains the reserve that gets you through a job loss or a new roof. The right price protects the monthly and the cushion at once, not one at the other’s expense.
- Everything else you’re funding. Childcare, a car loan, the retirement contributions you don’t want to pause. The house competes with all of it for the same paycheck, so a life with more fixed commitments can carry less house, whatever the lender’s ratio says.
- Property tax and insurance where you buy. ifso starts from typical rates, but they vary a lot by state and county. Set them to your real area, because at 2%-plus of the value a year they’re a bigger share of the monthly than people expect.
- Whether the surplus really gets invested. The gap between a right-sized house and the max is only worth something if you actually save it. If you know the extra room would just become more spending, the honest budget is the one that forces the saving for you.
Model your own home purchase
It takes a few minutes and no linked accounts. The goal isn’t a single verdict, it’s finding the price where the net worth line still climbs:
- 1Enter your accounts as they stand today, including the cash you’d use for a down payment, your income, and your current expenses.
- 2Add a Buy event at the price you’re eyeing, with your down payment and the mortgage rate and term you’ll actually get, funding the down payment from your savings.
- 3Add an upkeep expense of around 1% of the home’s value a year. Property tax and insurance are already handled for you, so check that their rates match where you’re buying.
- 4Set a primary account so any leftover cash flow is invested. That’s what turns an affordable house into growing net worth, and an unaffordable one into a draining balance.
- 5Step the price up and down and watch the monthly surplus and the net worth line. Where the line stops climbing is your ceiling; the price just under it is the one you can actually afford.
Still weighing whether to buy at all, rather than how much? Start one step back with should I rent or buy?
Now run your own numbers.
Try it free, no sign-upOpens right in your browser with a sample plan ready to edit, with no account needed. No email, no credit card. Create an account only if you want to keep your plan.