Plan your finances with ease. Make decisions with confidence.
Enter your finances today, add any number of decisions you're looking to make at any age, and see if you reach your financial goals.
Free to start. Nothing connects to your bank.
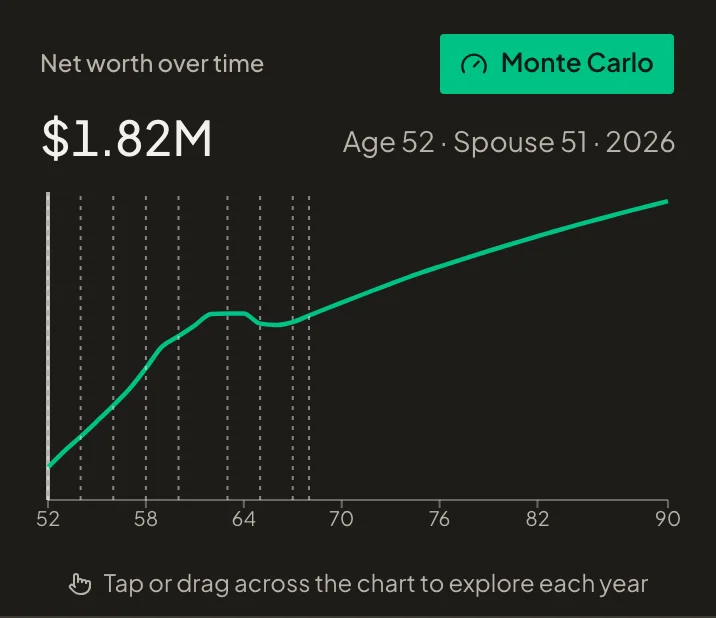
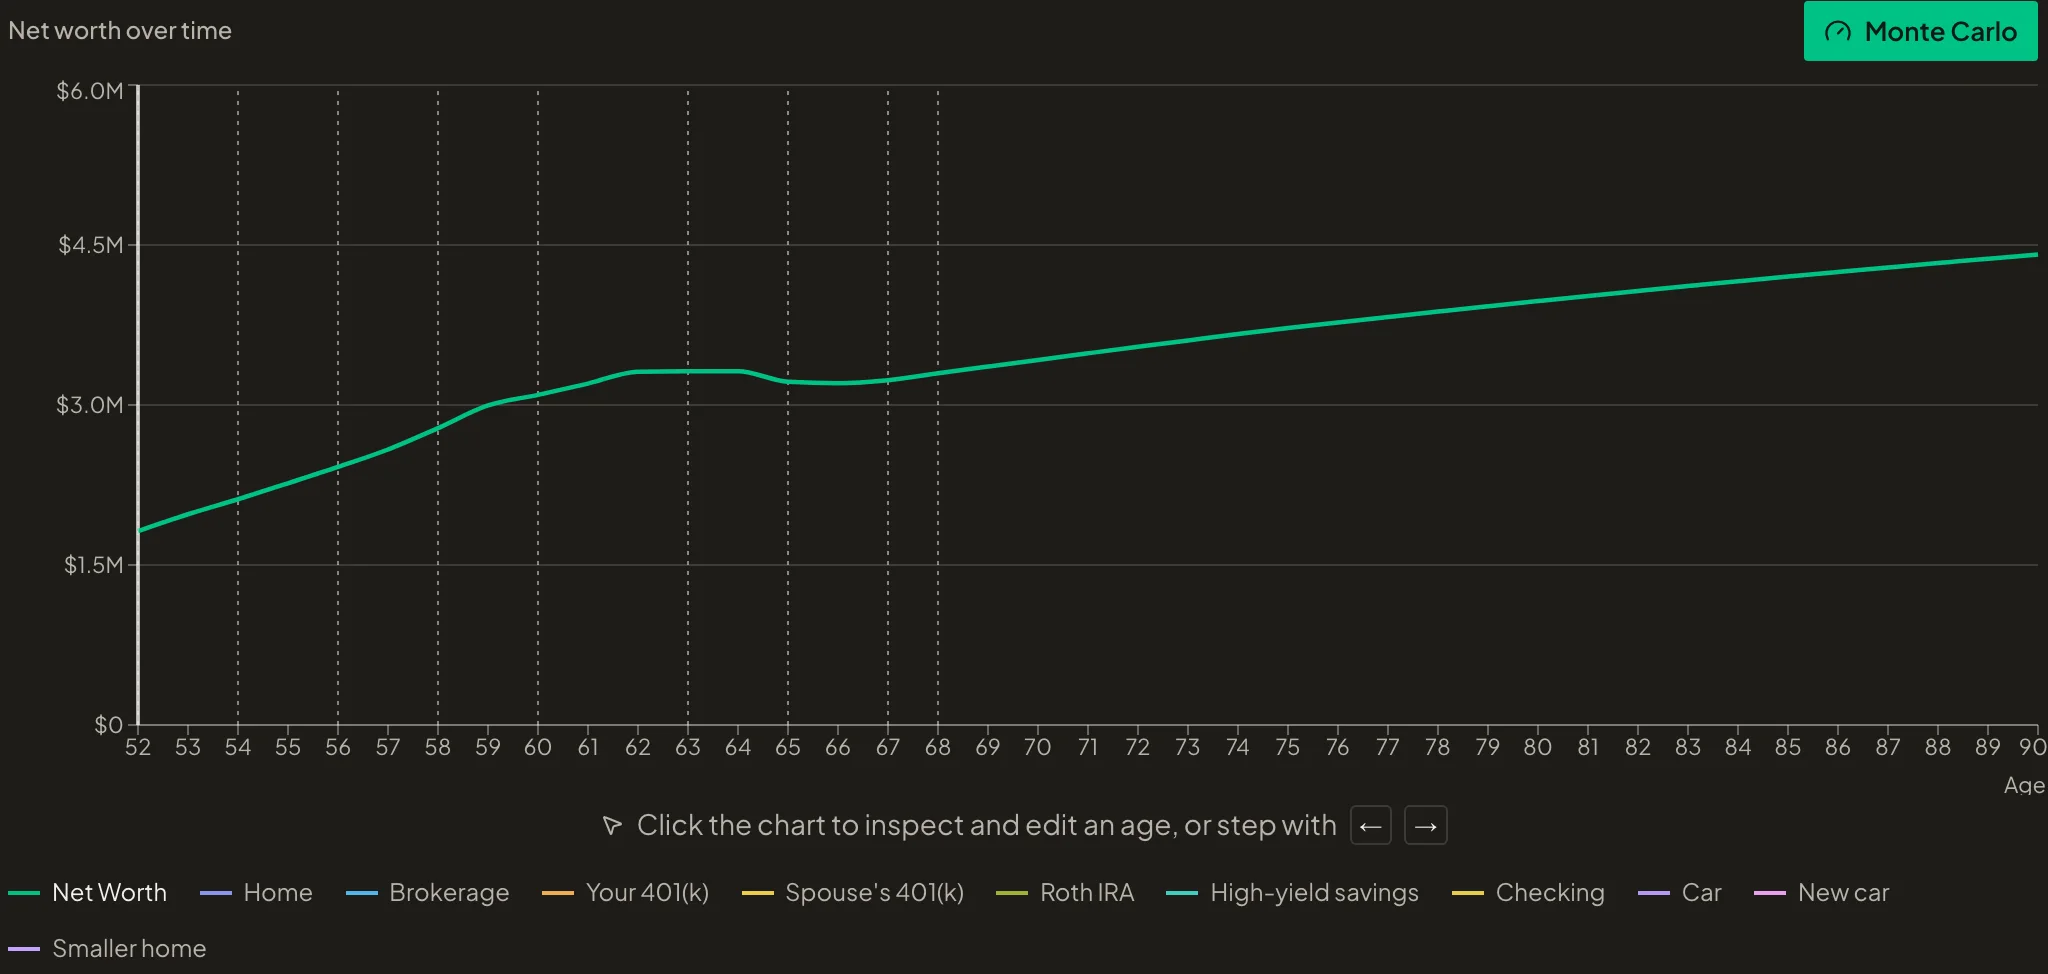
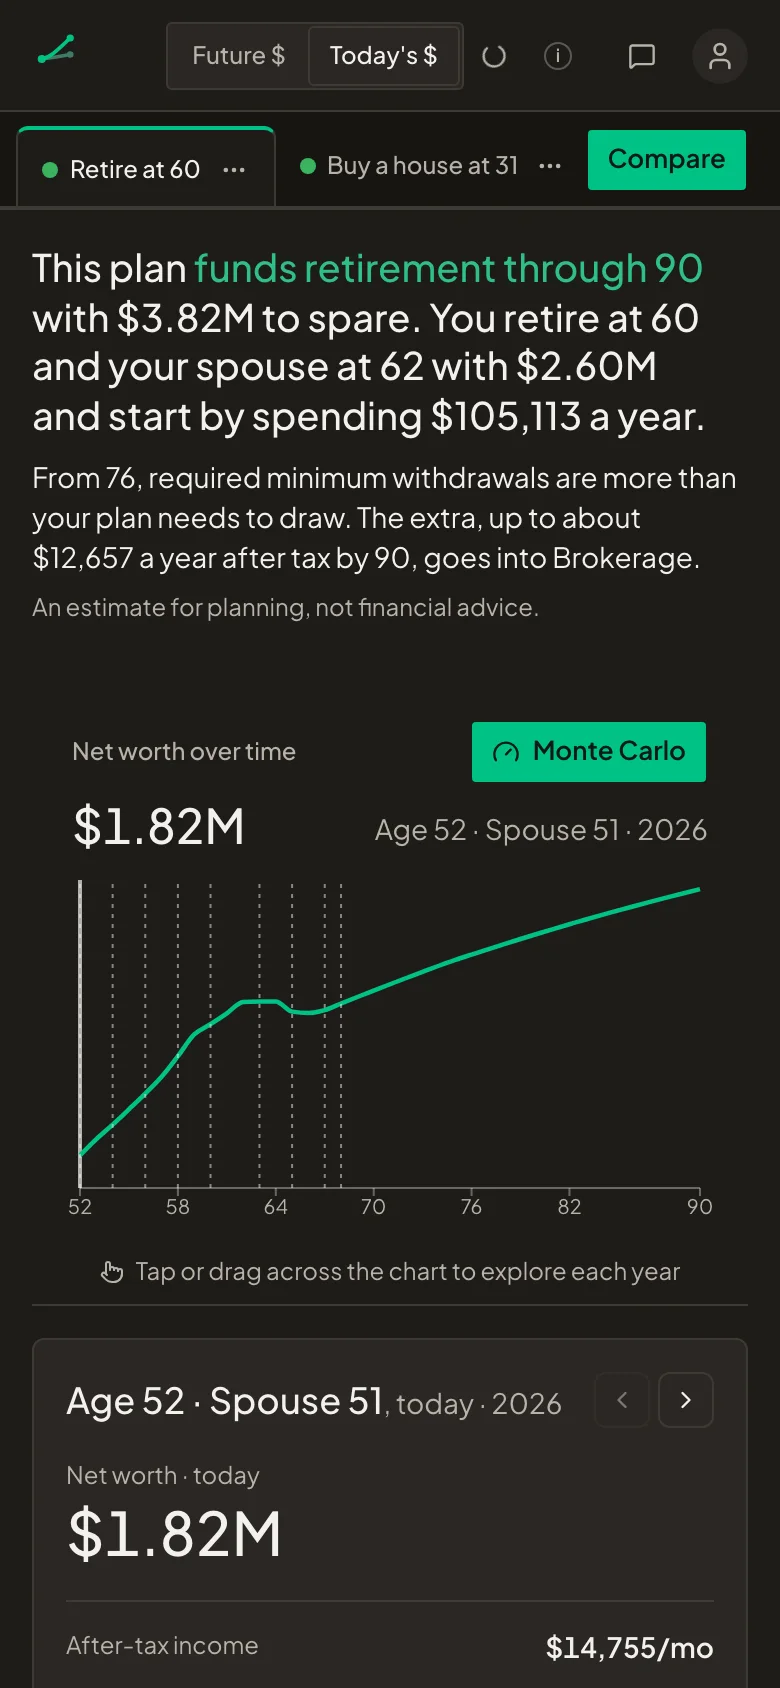
This plan funds retirement through 90 with $3.82M to spare. You retire at 60 and your spouse at 62 with $2.60M and start by spending $105,113 a year.
 Age 60You retire
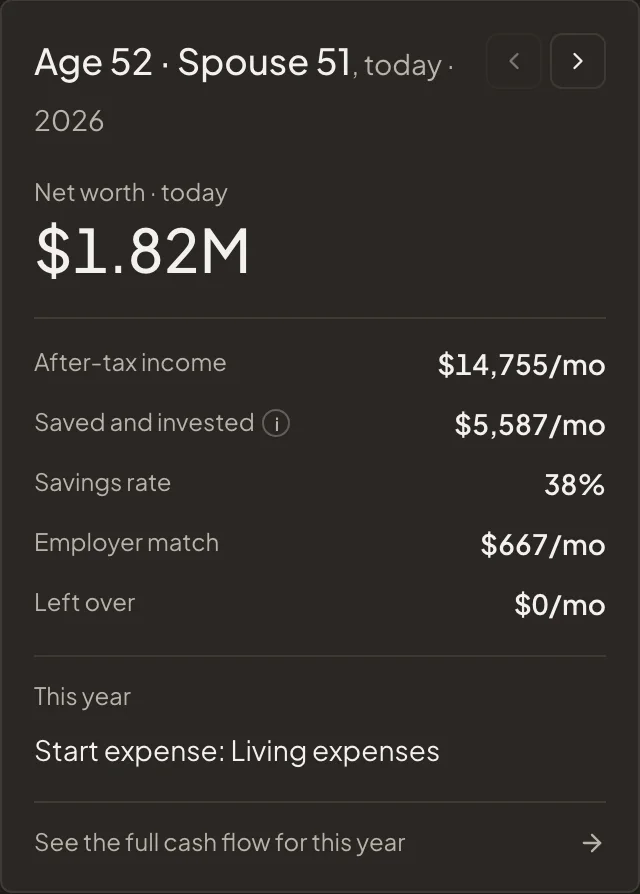
Enter your income, accounts, and expenses. Add a decision, like buying a house at 31 or retiring at 55, and ifso projects every year ahead with real tax math. It tells you whether the plan holds, and you can compare it against a plan where you decide differently.
Each plan ends with a plain answer, so you can easily tell how it plays out
Whether the plan stays funded through the age you plan to, or the age the money runs out. Under that, what you would retire with and what you could spend each year.
This plan funds retirement through 90 with $3.82M to spare. You retire at 60 and your spouse at 62 with $2.60M and start by spending $105,113 a year.
This plan runs out at 81. Retiring at 55 leaves $1.07M, and spending $110,422 a year uses it up in 26 years.
This plan funds retirement through 90 with $1.86M to spare. You retire at 60 with $2.03M and start by spending $79,689 a year.
Change any number, in any year, and see where it takes you
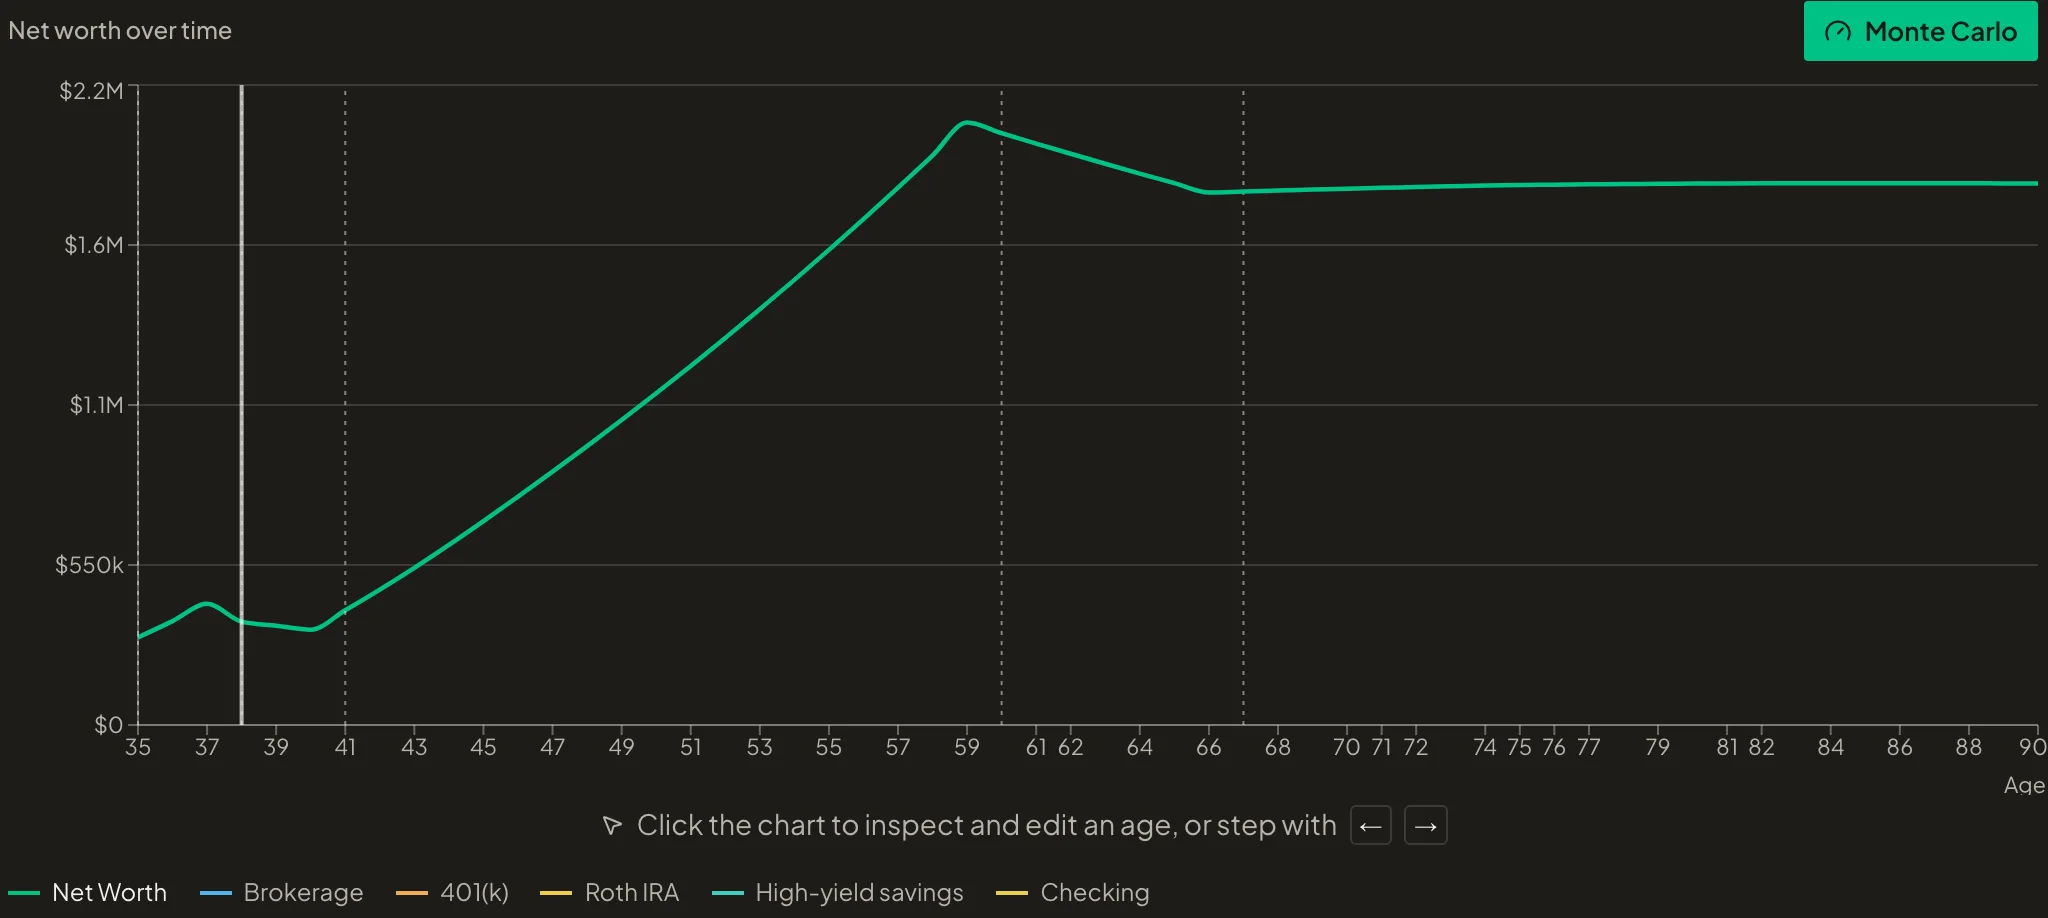
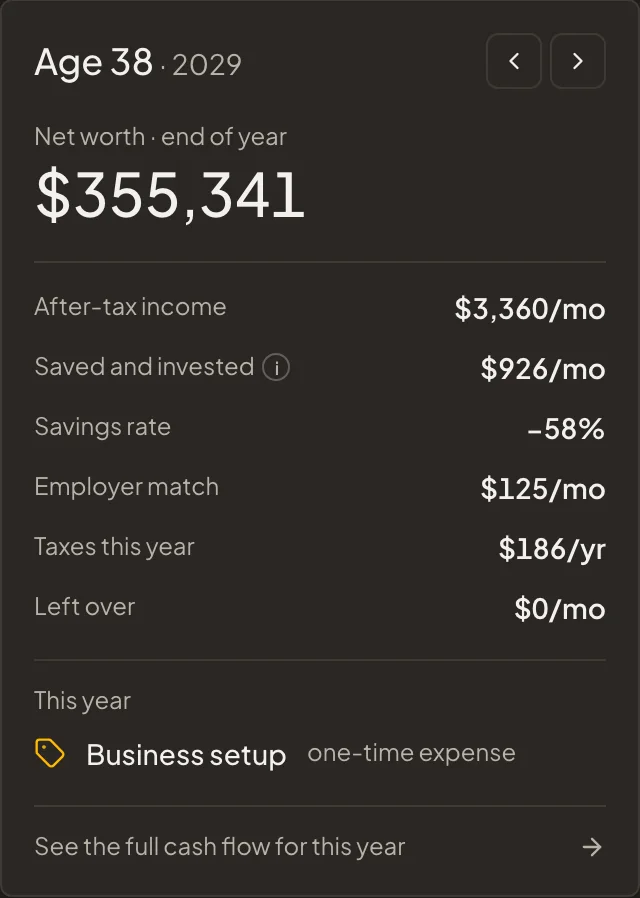
Click a year on the chart and edit what happens then. Here Devon quits at 38, takes $45k from savings, and earns $48k for three years. The years after that recalculate, including the 401(k) match that stops and the contributions that pick back up at 41.
A change made in one year carries forward from that year. Earlier years stay as they were.
Compare two plans and see which one works better for you
Two plans that start from the same numbers, shown together, with the difference at every age and a line saying which one holds.
Retire at 62 keeps your retirement funded. Retire at 55 runs out at 81.
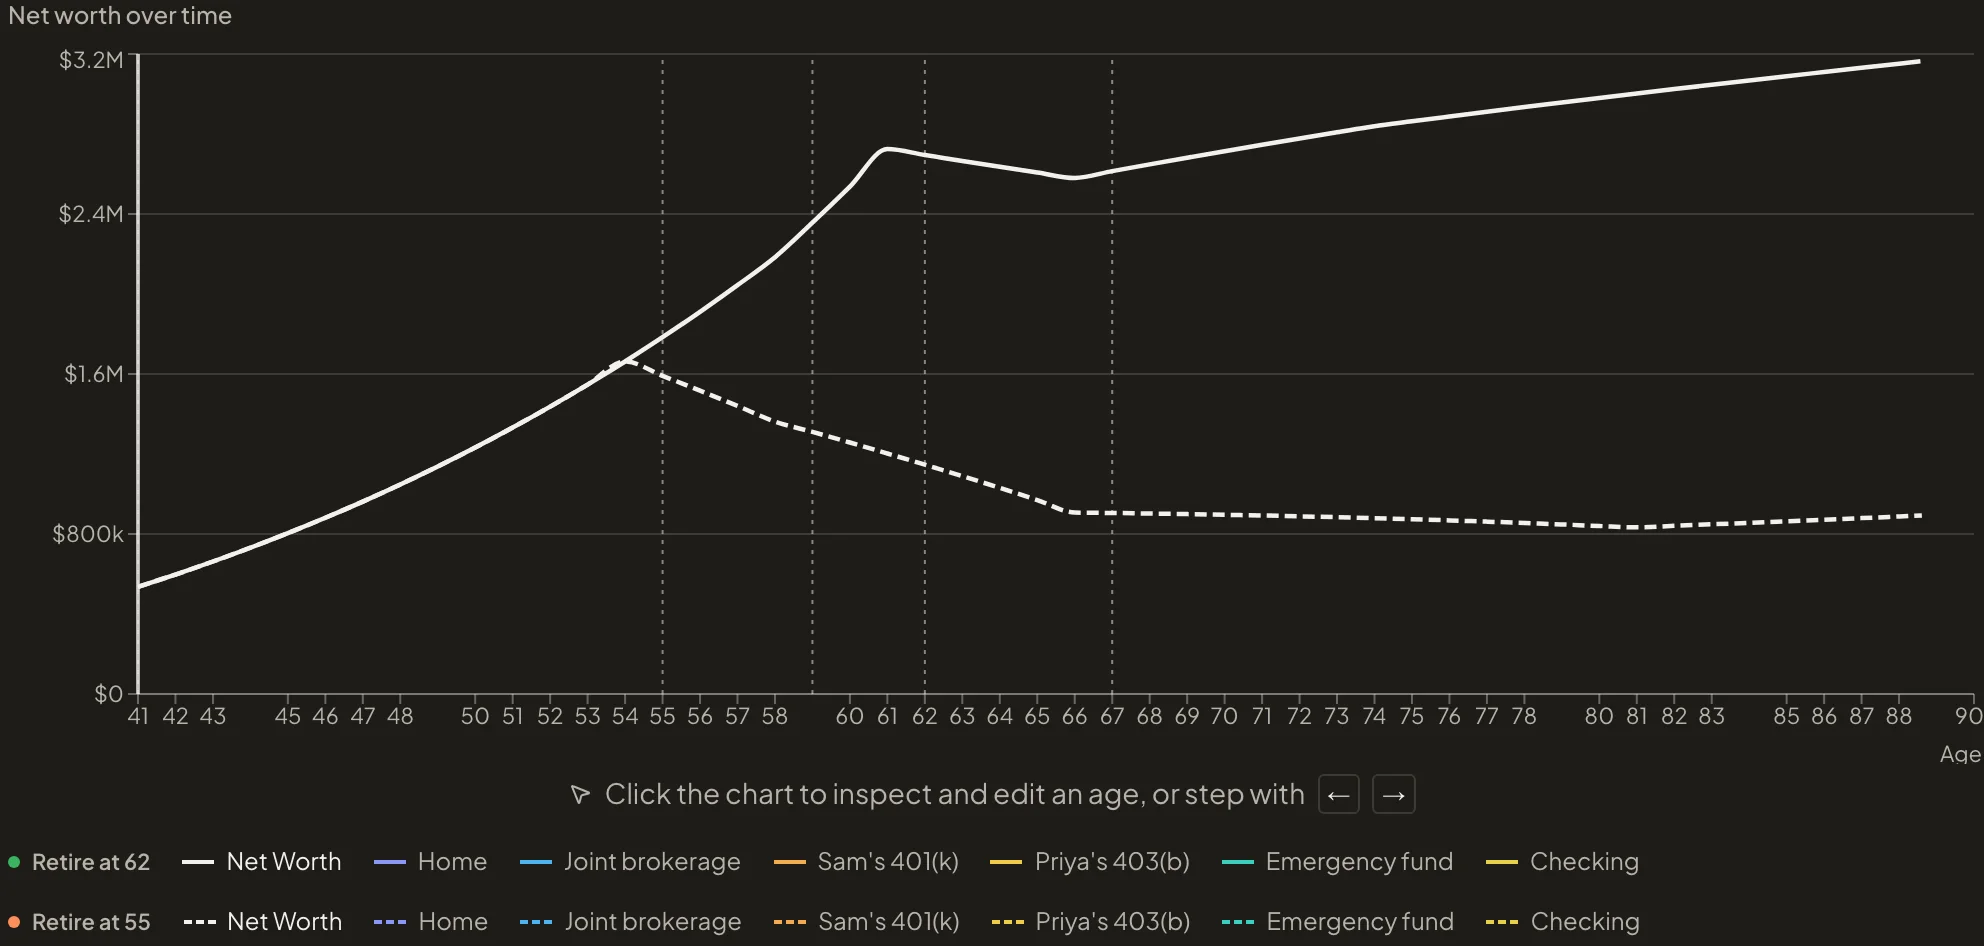
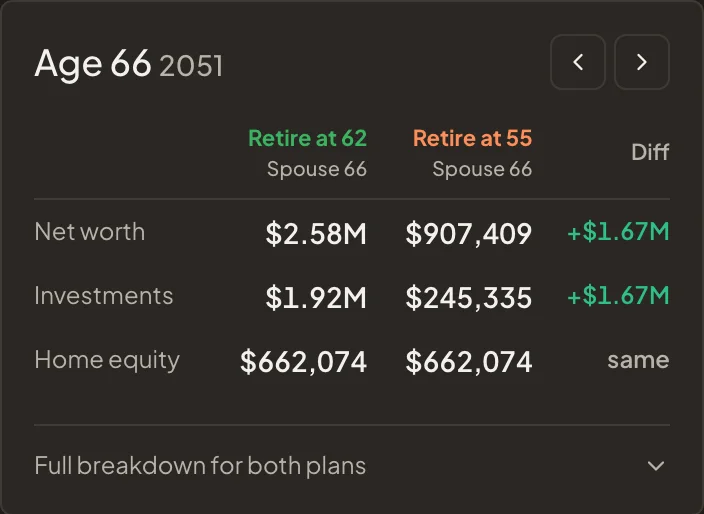
Both plans go on one chart, and the year card shows each number side by side for the selected age. At 66, retiring at 55 has left $907k against $2.58M, with the same house, kids, and salaries in both. The 55 plan runs out at 81.
Your plan is the sum of your decisions, all laid out in one place
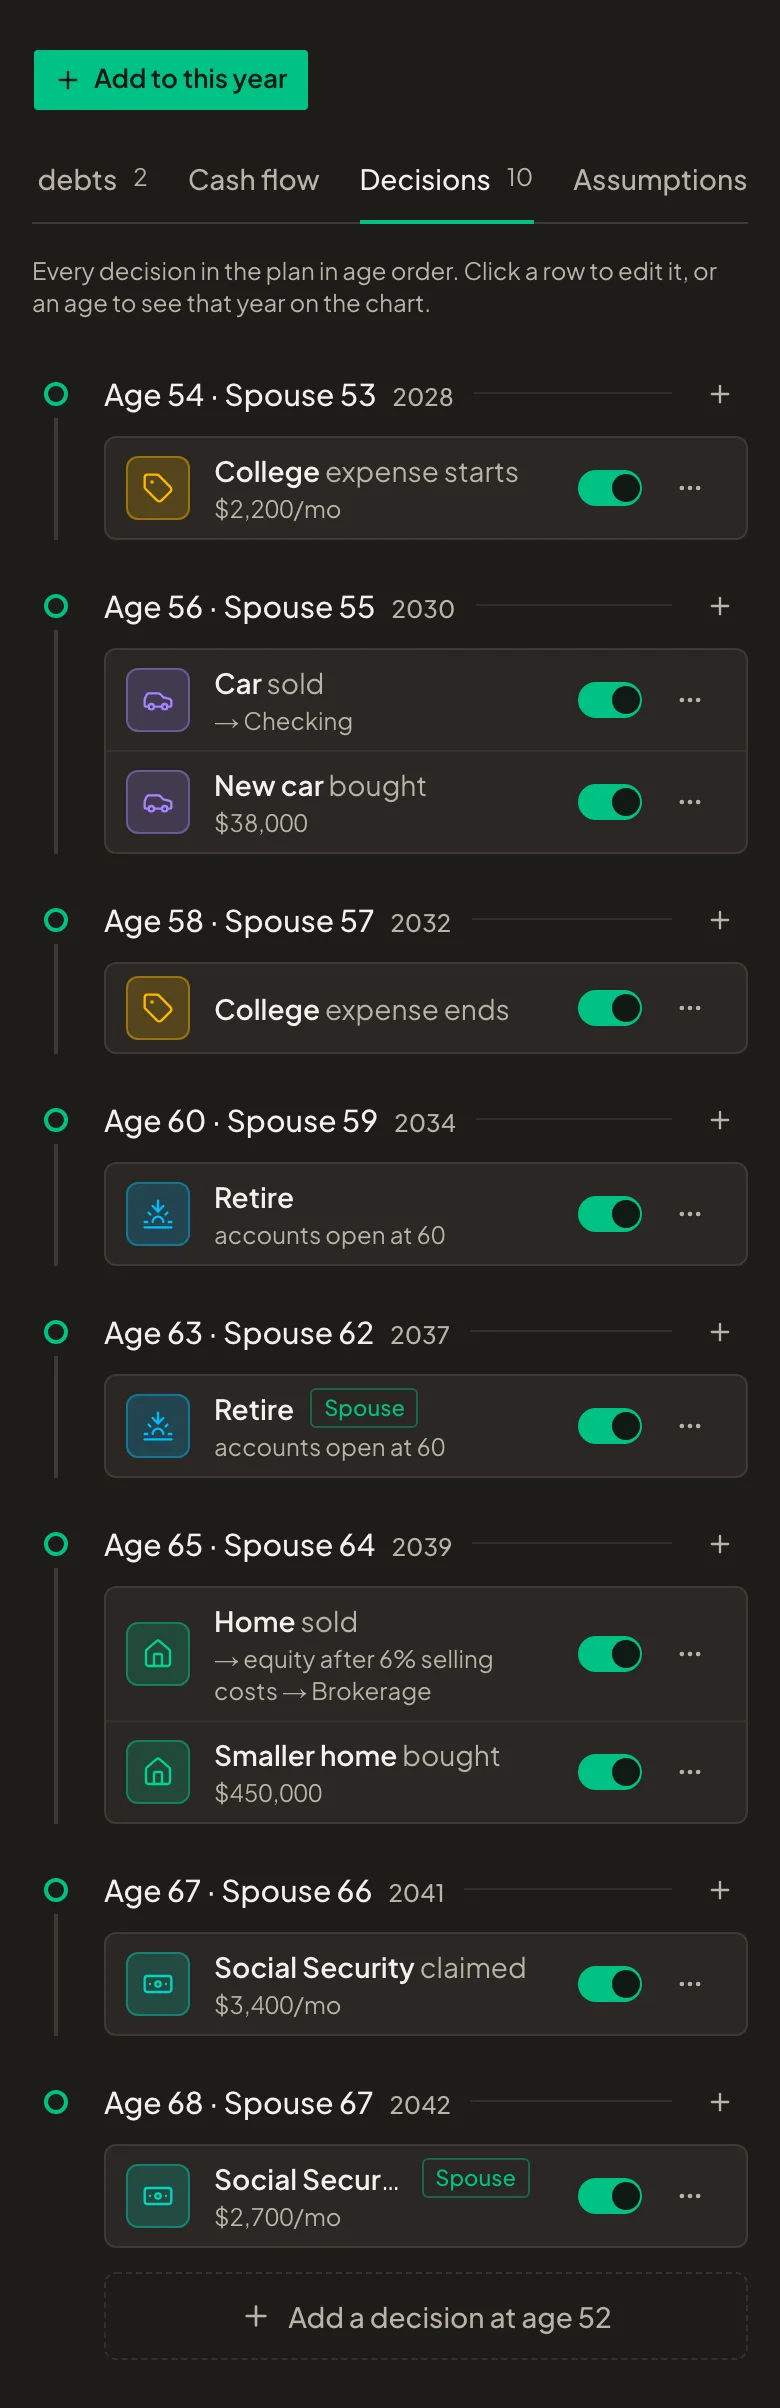
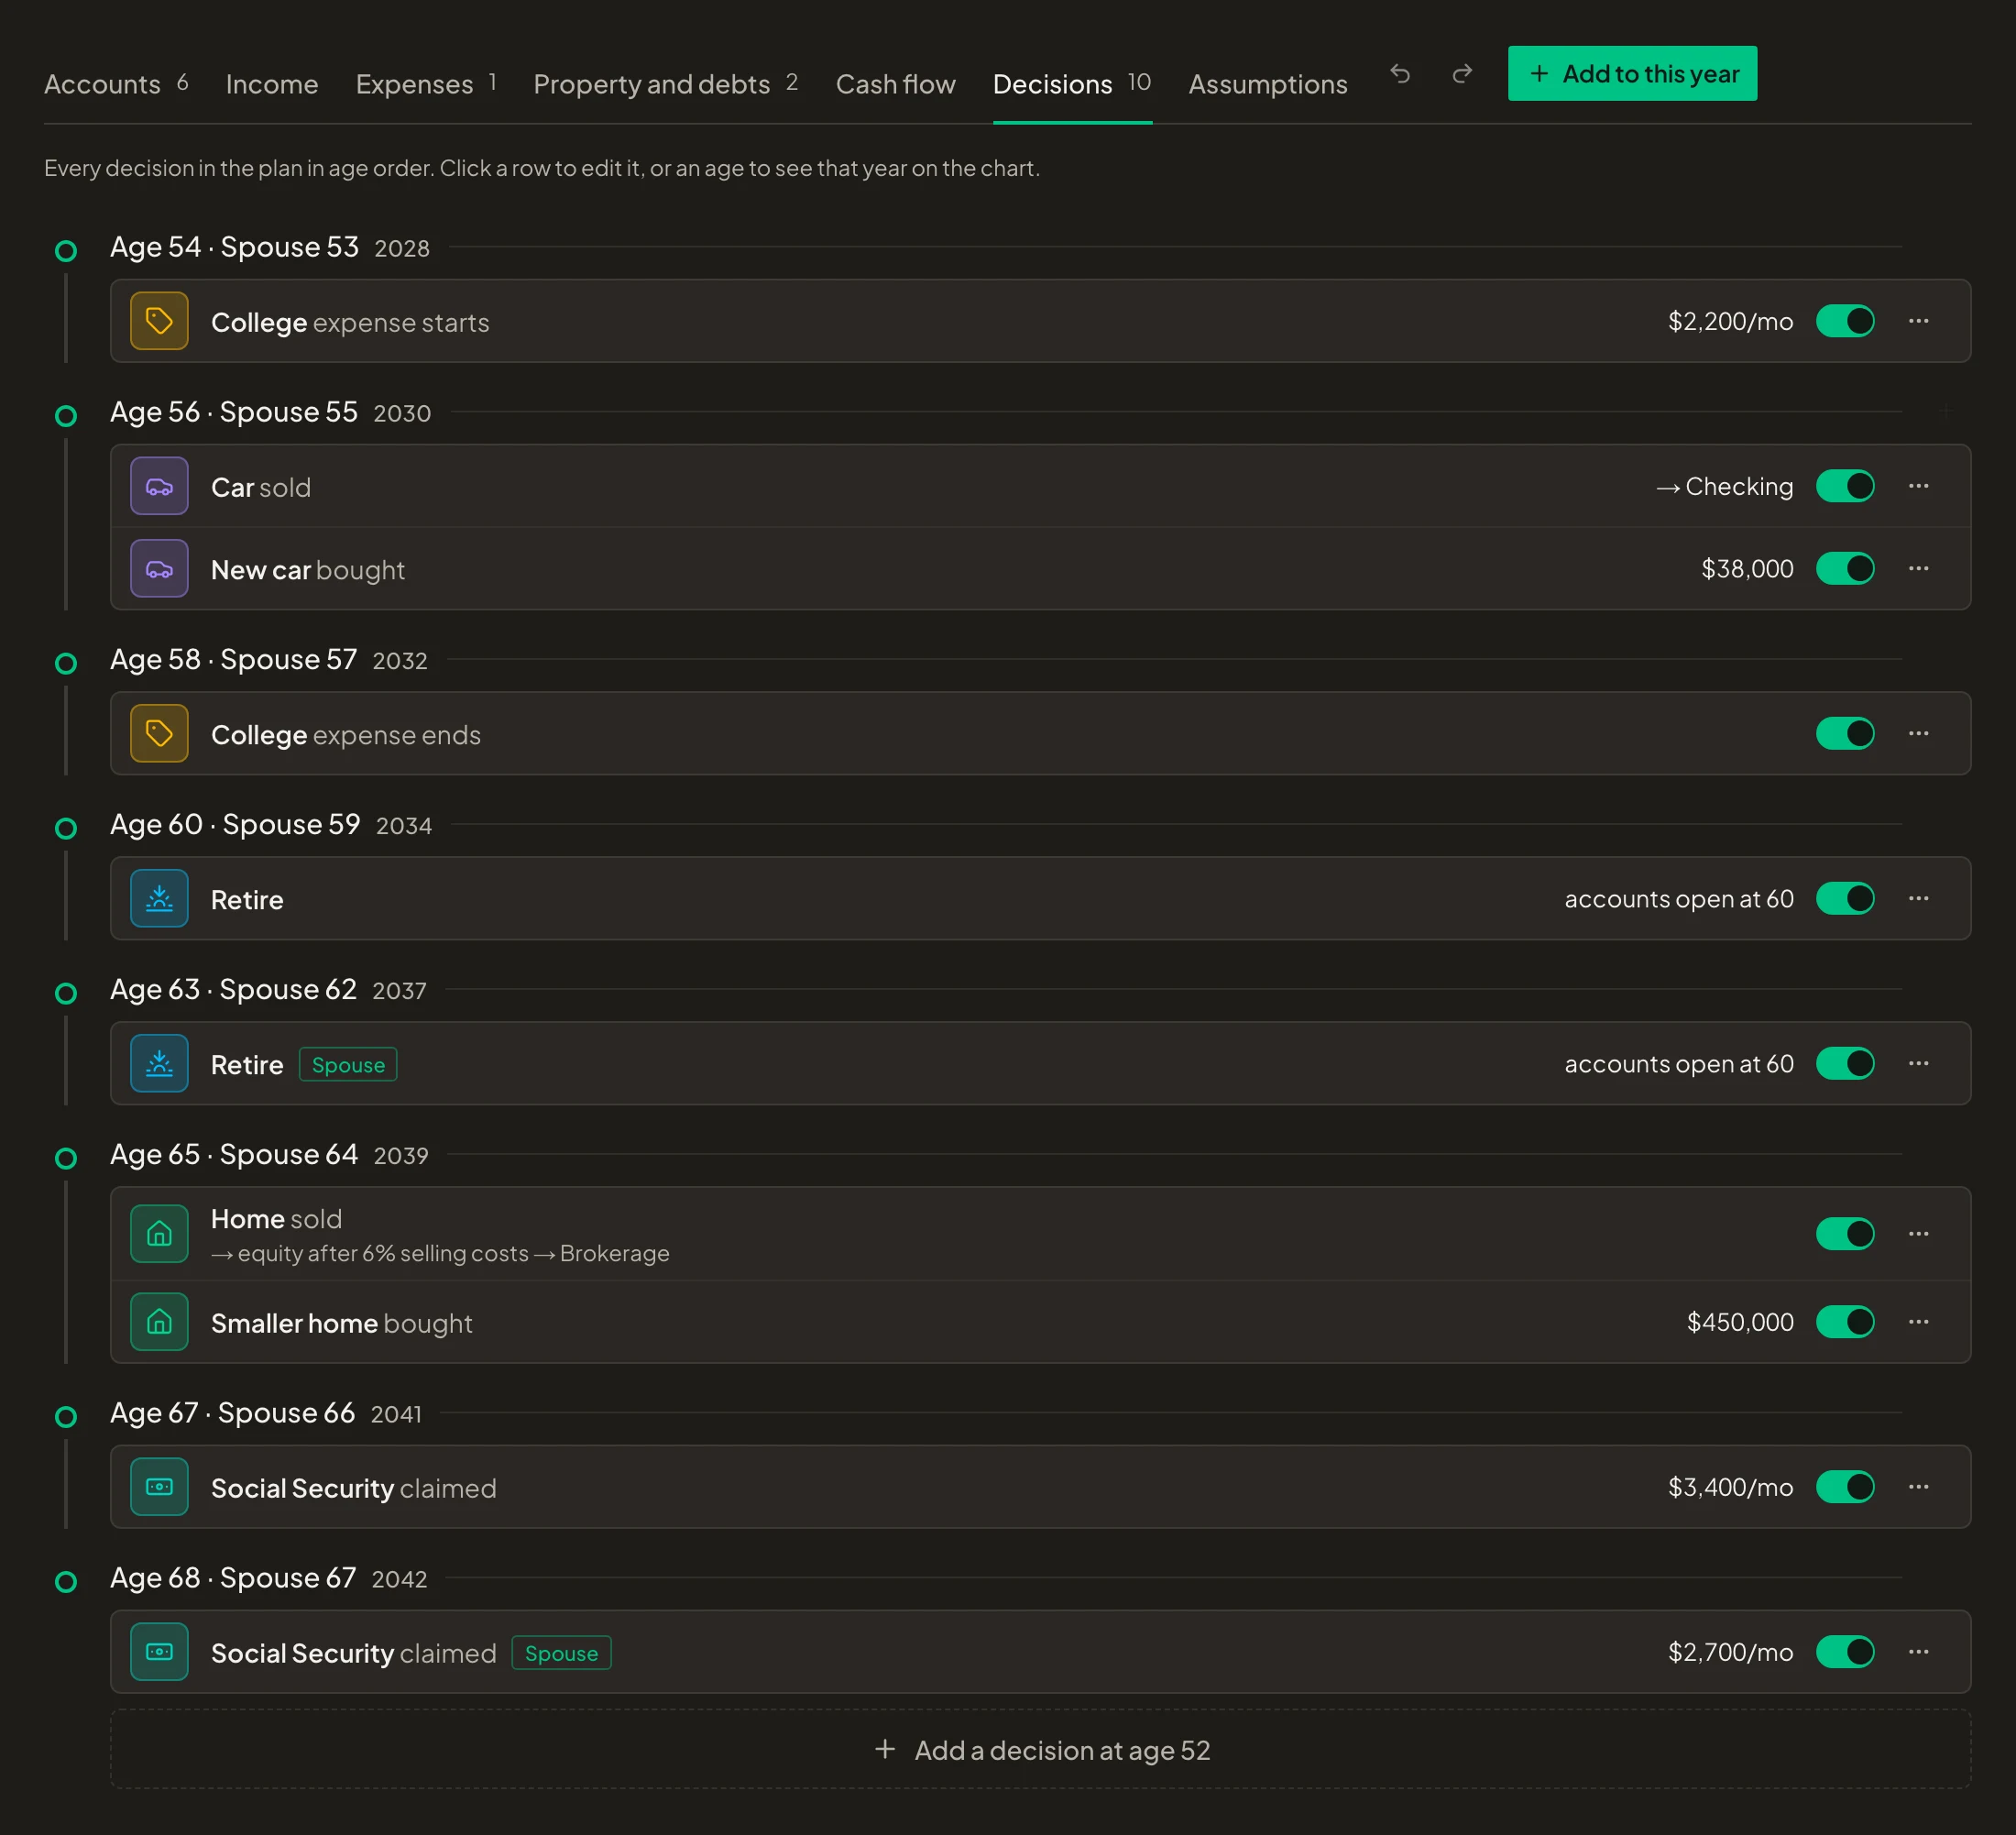
College for four years from 54. The car replaced at 56, with a loan. You retire at 60, your spouse at 62. At 65 the house is sold, the equity goes to the brokerage, and a smaller home is bought outright. Each of you claims Social Security at 67. That is the couple's whole plan, in age order, and each decision can be edited, switched off to see the plan without it, or removed.
Follow every dollar, with the taxes and account rules handled for you
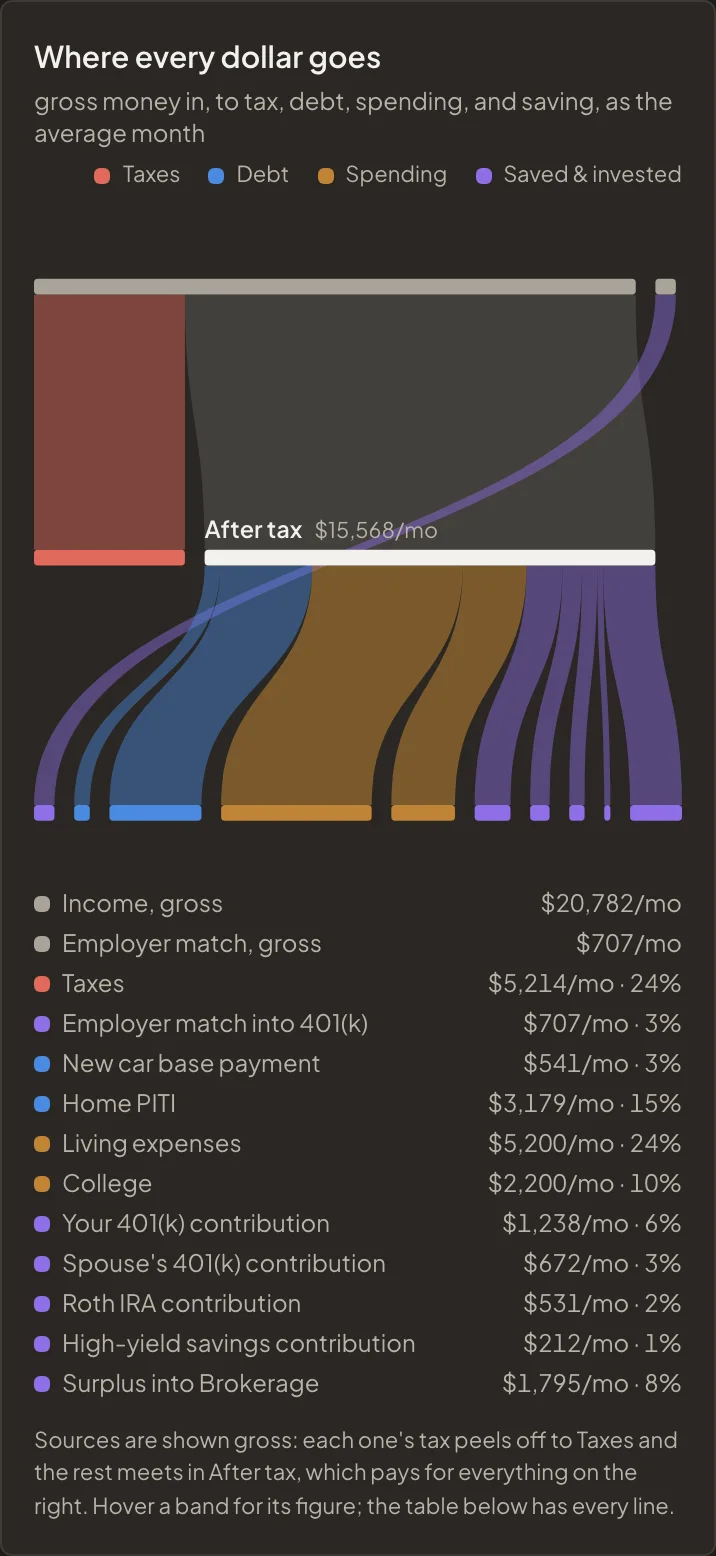
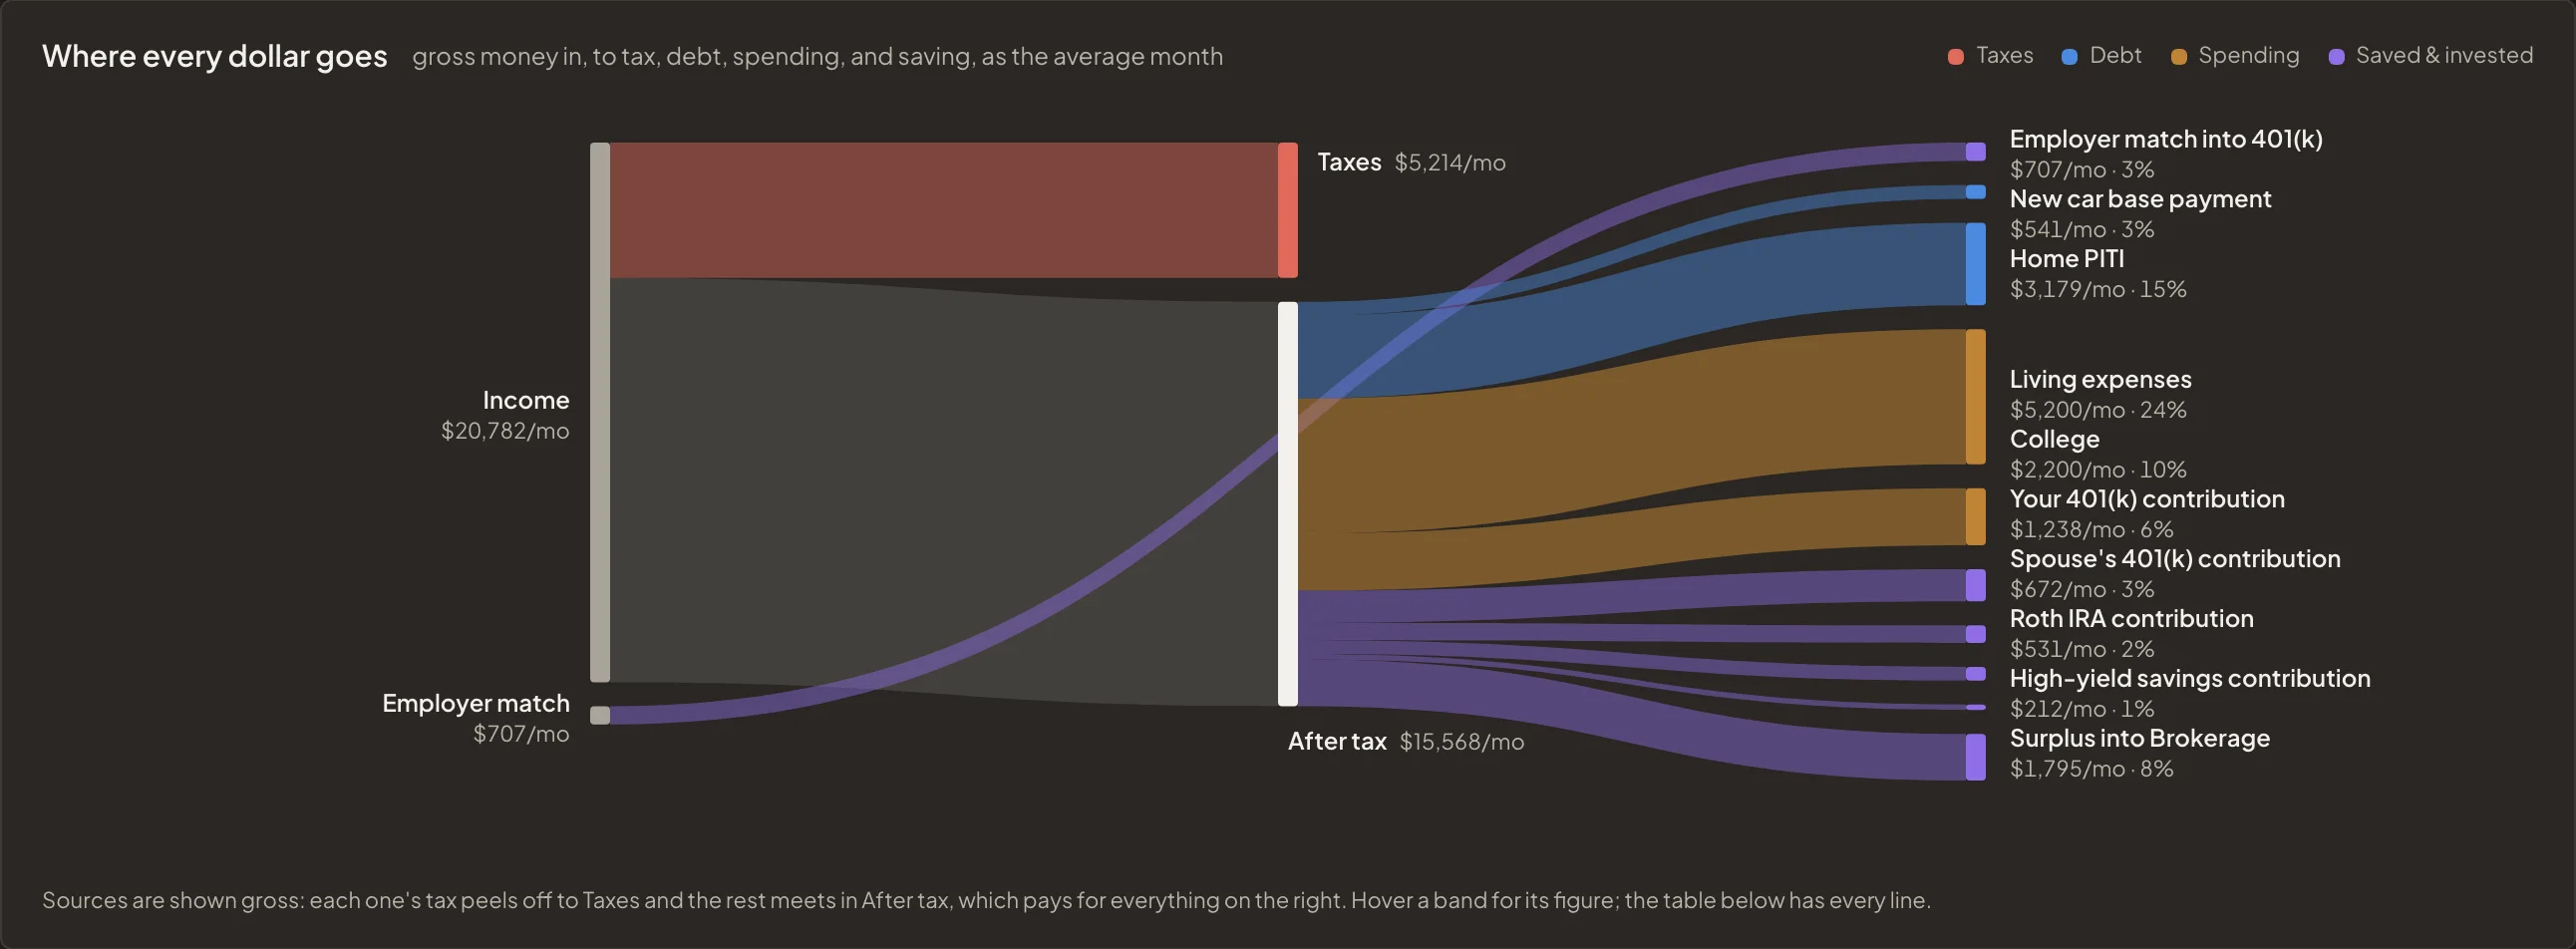
The couple at 56. Both incomes and the employer match come in gross, the tax peels off, and what is left pays the mortgage and the loan on the car replaced this year, living expenses and a year of college, both 401(k)s, the Roth IRA, and savings, with the surplus going into the brokerage. The table under the diagram has every line.
Simple calculators use one return and one tax rate for every year. ifso works through each year with the rules that apply to it.
Plans for couples
Add your spouse with their own age, income, retirement date, and Social Security claim. Taxes are worked out for married filing jointly.
Federal brackets and state tax
Worked out each year from that year's income, for single or married filing.
401(k) and IRA rules
Contribution limits, employer match caps, traditional or Roth, and the age you can withdraw.
Mortgages that amortize
Principal, interest, property tax, and insurance, for as many properties as you own.
Rentals
Turn a home you own into a rental, with rent, vacancy, and upkeep from that year on.
Capital gains
Tax on the gain when investments or a property are sold, with the primary residence exclusion when it applies.
Social Security claim ages
The benefit is adjusted for the age you claim it.
Required minimum distributions
Taken from the year the IRS says they start, taxed as income, with anything beyond what your plan needs to draw reinvested.
Roth conversions
Move traditional money into a Roth each year before required minimums start, a set amount or up to the top of a tax bracket, and see what it costs now and saves later.
Inflation and raises
Shown in today's dollars or future dollars, with a toggle.
Monte Carlo
Runs the plan many times with varying market returns and reports how often it holds.
Your numbers stay yours
Nothing connects to your bank. You type the numbers in yourself, on a laptop or a phone. It takes a few minutes.
No account until you want one. The sample plan runs without signing in. When you sign in to keep a plan, everything you entered can be downloaded as a file or deleted along with the account, from the account page, whenever you like.
Pricing
The first plan is free. More plans, compare, the year's cash flow, the Monte Carlo range, Roth conversions, and rentals are $9 a month or $69 a year. You can try it without an account and sign in when you want to keep the plan.
Pro
$9 /month or $69/year
Cancel any time
- More plans
- Compare two side by side
- Where every dollar goes each year
- The Monte Carlo range of outcomes
- Roth conversions
- Rentals
- Everything in Free